Header Image - Computational Scientist

Yearly Archives

5 Articles

Web application for resolution of DGS instruments: first release

by Jiao

The new website should be pretty straightforward to navigate, but here are some quick explanations:

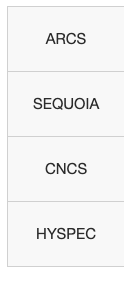
At the start, the instrument selection is shown on the top left of the page. Click on one instrument to start.

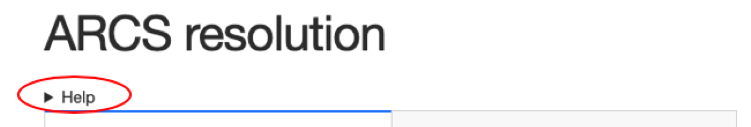
Click “Help” under the page banner will show some information about the data and modeling

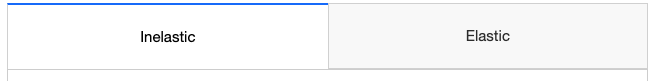
For each instrument there are two tabs. One for inelastic energy resolution plots, one for elastic resolution plots.

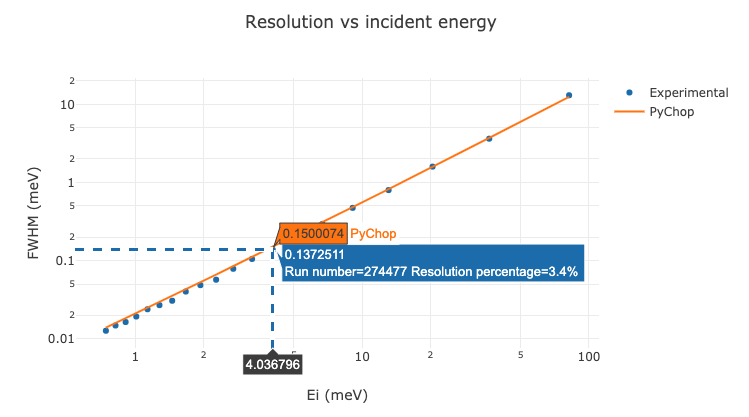
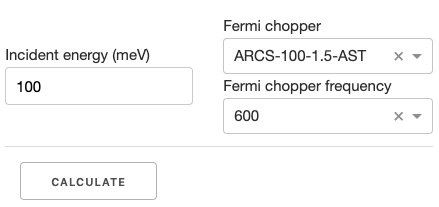
In the inelastic page, there is a form to choose incident energy and some (chopper) settings. Click the “Calculate” button will calculate the resolution curve using those settings

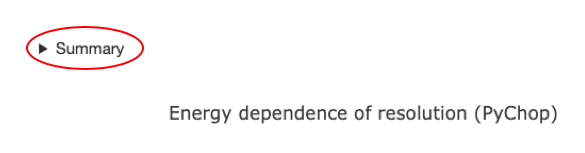
Click “Summary” above the resolution-vs-energy plot will display some basic information such as FWHM at elastic line

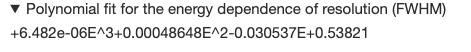
Below summary, a polynomial fit result may be displayed (only CNCS for now)

Click the download button below the resolution-vs-energy plot will download a csv file

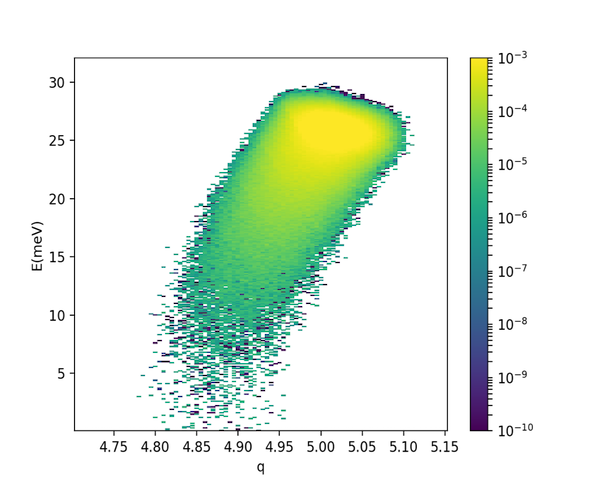
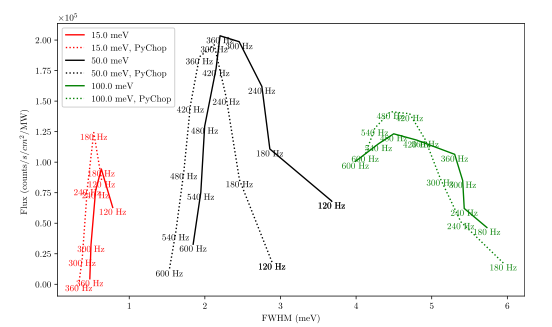
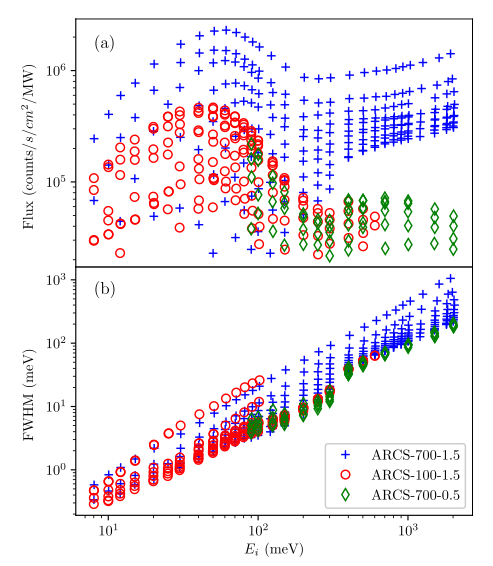
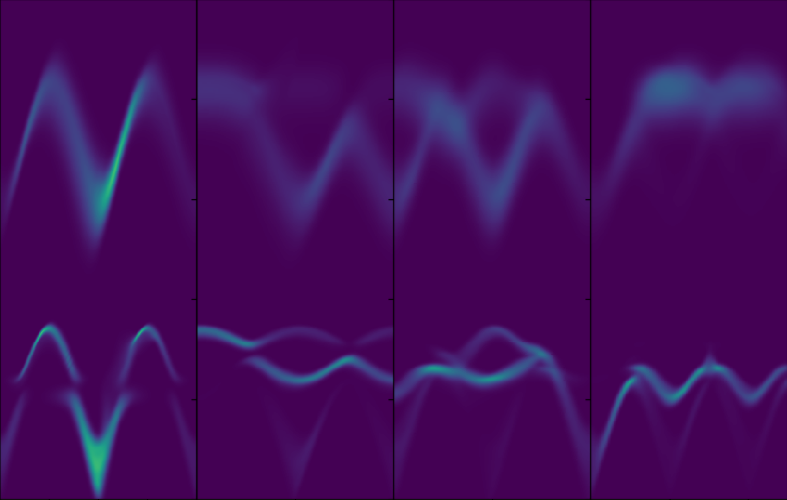
The elastic tab shows some plots about the elastic resolution/flux information. It is different from instrument to instrument, because different kinds of data exist for different instruments.

Super-resolution satellite image correlation helps study glacier erosion law

by Jiao
Super-resolution satellite image correlation helps study glacier erosion law

published in Science on Oct 9, 2015. https://science.sciencemag.org/content/350/6257/193.

From Wikipedia: “A glacier is a persistent body of dense ice that is constantly moving under its own weight; it forms where the accumulation of snow exceeds its ablation (melting and sublimation) over many years, often centuries”

  • Glacier erosion has obvious effects on the landscape of the Earth
  • Glacial erosion rates span several orders of magnitude from polar and dry regions to temperate alpine glaciers, and from hill-slope landscapes to steep, tectonically active mountain ranges

Glacier erosion power law was proposed by Jonathan Harbor, Bernard Hallet, and Charles Raymond, Nature, 1988.

But what is value of b, the power factor?

Sub-pixel image correlation techniques for satellite imagery were developed and used in this study to obtain accurate 3D model of the glacier surface, and then its moving speed, u, and helped constrain the value of b.

  • ~50k lines of python/C++ code for Satellite Image Correlation
  • Include the full DEM workflow of ancillary data correction (bundle correction), tie-points generation, orthorectification, correlation, triangulation, and gridding

Energy dependence of the flux and elastic resolution for the ARCS neutron spectrometer

by Jiao
Energy dependence of the flux and elastic resolution for the ARCS neutron spectrometer

Flux and elastic resolution for a wide range of instrument conditions were measured and modeled for the ARCS chopper spectrometer.

This work provides a key reference for users of the ARCS instrument, making it easier for users to plan for their experiments. The online interactive resolution/flux plots make it much easier for ARCS users to take educated tradeoff between resolution and flux, while taking their experiment requirements into account.

Research details:

  • A series of vanadium calibration measurements for a wide range of incident energies were performed for the ARCS direct geometry chopper spectrometer
  • Analytical models were able to reproduce most of the general trends observed in the measurements.
  • MCViNE simulations were used to confirm modeling results when experimental results are not reliable for direct measurement of resolution

This work was published at https://doi.org/10.1016/j.physb.2018.11.027.