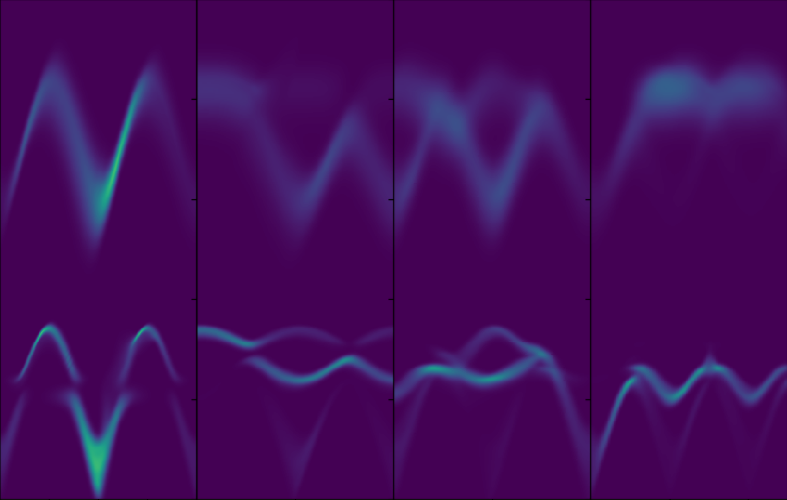
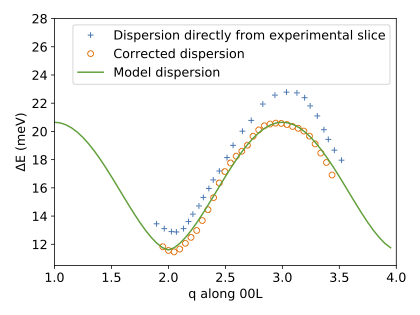
Super resolution phonon Density of States from the ARCS instrument, a neutron Direct Geometry Chopper Spectrometer
Read MoreCNN model for methane detection using remote sensing imagery
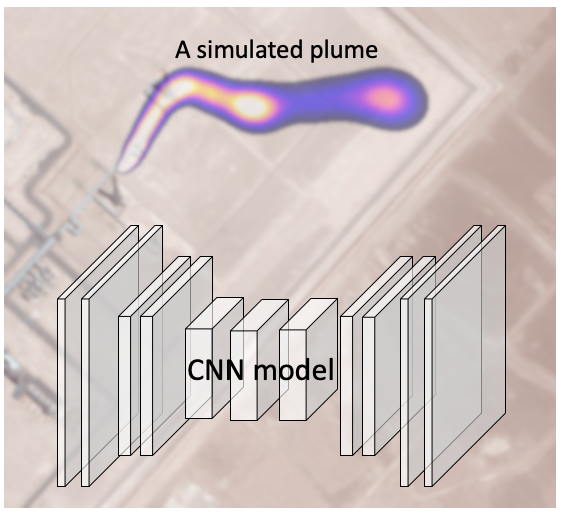
A convolutional neural network (CNN) model was built to predict trace-gas concentration from remote sensing images for the first time.
A remote sensing system with multi-spectral or hyper-spectral capabilities can be used to identify materials and their compositions on the ground from a few miles (airplanes) to hundreds of miles (satellites) away in the sky. It could be also used to detect trace gas (such as methane, an important greenhouse gas) near the ground if condition is right.
Such detection relies on the individual spectrum for each pixel in the multi- or hyper- spectral remote sensing image. Trace gas like methane has a signature absorption spectrum that sometimes can be identified from remote-sensing spectra. As a result, the methane concentration could be obtained for each single-pixel spectrum, and an image of methane concentration can be derived accordingly. This is the pixel-wise approach. However, the result of this pixel-wise approach can be quite noisy and has very large error bars due to various reasons such as low reflectivity of some ground covers, and fluctuation in detector sensitivity.
A CNN model can be used to mitigate some of these problems by combining information from neighboring pixels. However, to train such a model, a large amount of data needs to be available for the supervised learning, while remote sensing data with ground truth of trace gas concentration is scarce and it is very expensive to acquire large amount of training data.
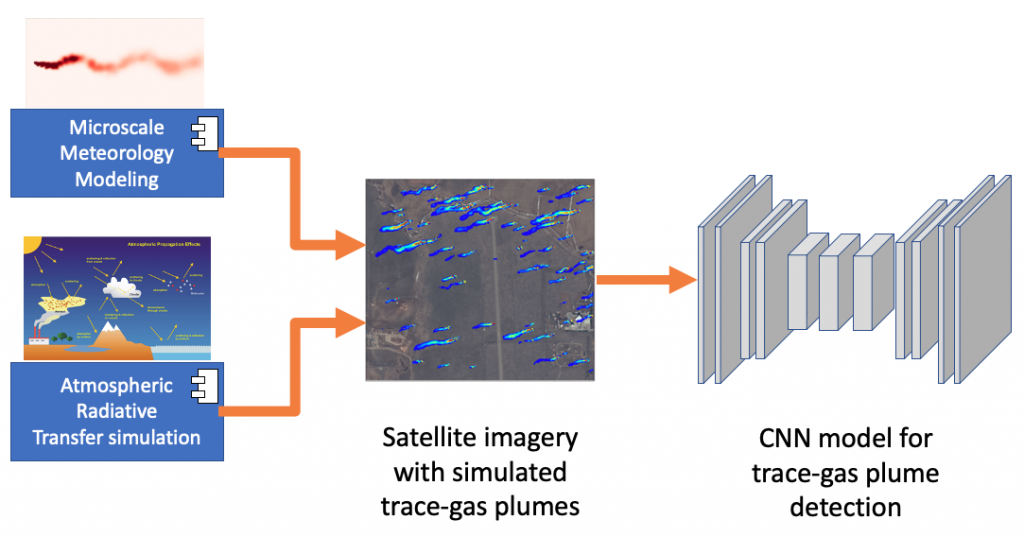
To overcome the data problem, we combined micro-scale meteorology modeling and atmospheric radiative transfer simulation to obtain synthetic satellite images. This allows us to build sufficient amount of training, validation, and testing images for our CNN model which helps facilitate methane detection. This novel, CNN-based method improves greatly the robustness of methane detection, compared to the traditional pixel-wise approach.
This is a satelytics project.
DGSRES
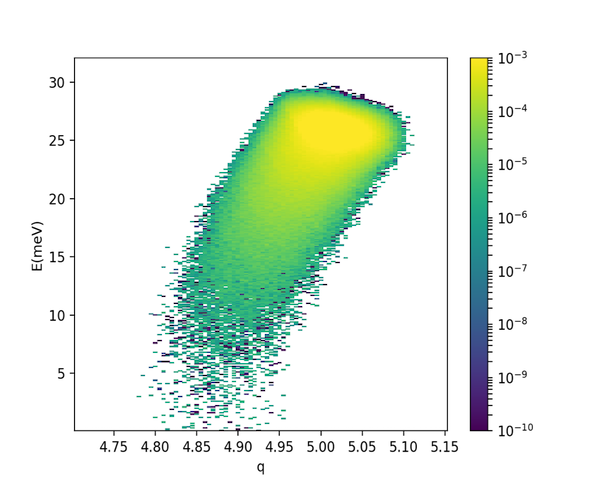
The resolution function in direct geometry neutron chopper spectrometers are fascinating. They exist up to 4 dimension in powder and single crystal experiments.
- Web app
- Experimental data for ARCS and SEQUOIA
- Published ARCS data
- Source code
Super-resolution satellite image correlation helps study glacier erosion law

published in Science on Oct 9, 2015. https://science.sciencemag.org/content/350/6257/193.
From Wikipedia: “A glacier is a persistent body of dense ice that is constantly moving under its own weight; it forms where the accumulation of snow exceeds its ablation (melting and sublimation) over many years, often centuries”
- Glacier erosion has obvious effects on the landscape of the Earth
- Glacial erosion rates span several orders of magnitude from polar and dry regions to temperate alpine glaciers, and from hill-slope landscapes to steep, tectonically active mountain ranges
Glacier erosion power law was proposed by Jonathan Harbor, Bernard Hallet, and Charles Raymond, Nature, 1988.

But what is value of b, the power factor?
Sub-pixel image correlation techniques for satellite imagery were developed and used in this study to obtain accurate 3D model of the glacier surface, and then its moving speed, u, and helped constrain the value of b.
- ~50k lines of python/C++ code for Satellite Image Correlation
- Include the full DEM workflow of ancillary data correction (bundle correction), tie-points generation, orthorectification, correlation, triangulation, and gridding
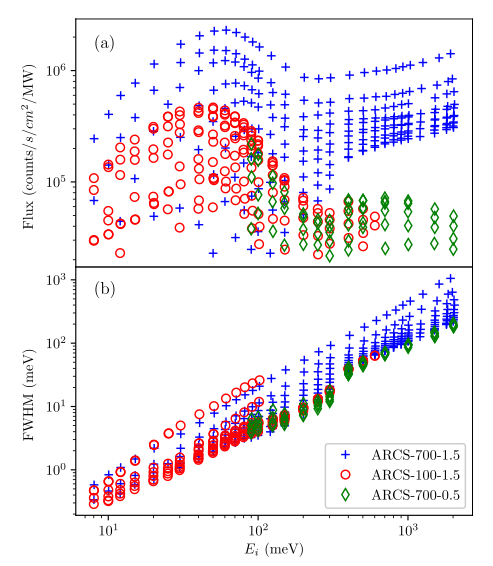
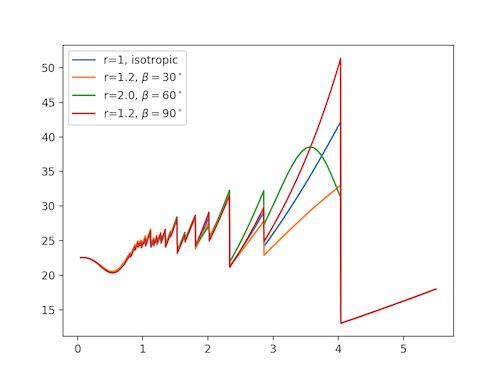
Energy dependence of the flux and elastic resolution for the ARCS neutron spectrometer
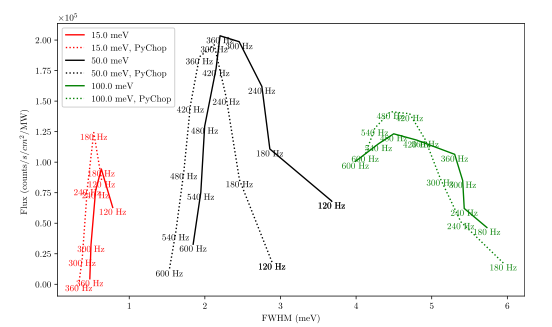
Flux and elastic resolution for a wide range of instrument conditions were measured and modeled for the ARCS chopper spectrometer.
This work provides a key reference for users of the ARCS instrument, making it easier for users to plan for their experiments. The online interactive resolution/flux plots make it much easier for ARCS users to take educated tradeoff between resolution and flux, while taking their experiment requirements into account.
Research details:
- A series of vanadium calibration measurements for a wide range of incident energies were performed for the ARCS direct geometry chopper spectrometer
- Analytical models were able to reproduce most of the general trends observed in the measurements.
- MCViNE simulations were used to confirm modeling results when experimental results are not reliable for direct measurement of resolution
This work was published at https://doi.org/10.1016/j.physb.2018.11.027.
Monte Carlo neutron ray-tracing simulations for neutron scattering experiments
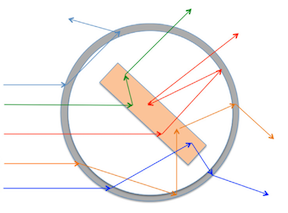
- A software framework for Monte Carlo ray-tracing simulation of modern neutron instruments, including novel sample/sample environments, and sophisticated detector systems.
- It contributes to the design of all 8 selected instruments in the first phase of the STS project. Relevant publications can be found here.
- ~570k lines of C++/Python.
Links
BraggEdgeModeling
Neutron Bragg edge modeling
iMars3D: Neutron tomography reconstruction
A snapshot of a neutron CT reconstruction.
Neutron has greater penetration depths and has different cross section dependency on elements than X-ray. Neutron tomography can be used to study a variety of larger samples and is finding applications in engineering, material science, biology, and archeology. This package is in use by ORNL neutron imaging beamlines for neutron CT reconstructions.
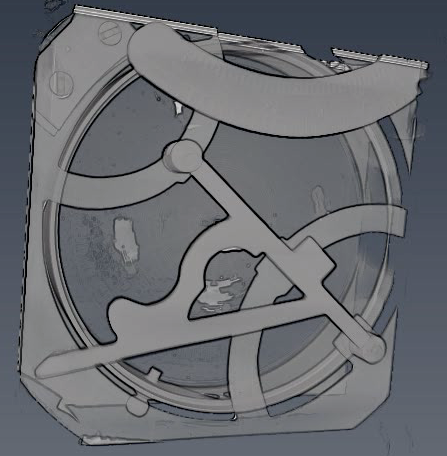
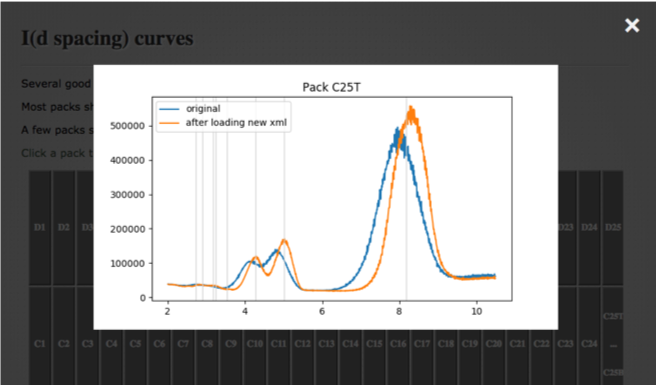
SEQUOIA detector calibration
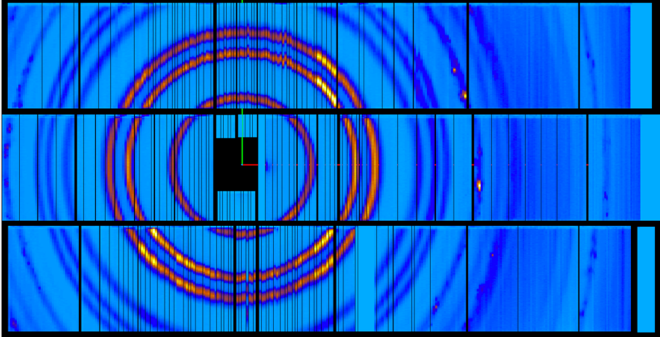
- Detector geometry calibration was performed using powder Si and C60 calibration datasets to better determine the positions and orientation of detector packs in the SEQUOIA instrument.
- Positioning of some detector packs were significantly improved
A website for this calibration work is at https://sns-chops.github.io/SEQ-IDF-12292017/